Mastering Data Visualization: Techniques, Best Practices, and Emerging Trends
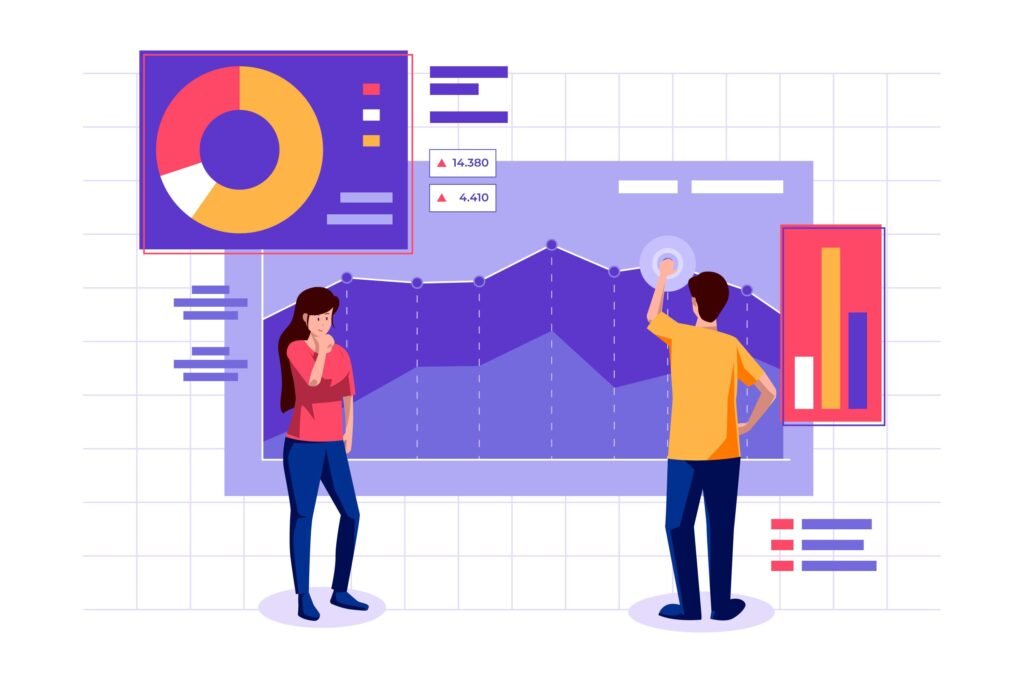
Data visualization plays a pivotal role in translating complex datasets into understandable, insightful narratives. With the vast amounts of data generated daily, the ability to effectively communicate insights has never been more critical. This blog post delves into various data visualization techniques, offering insights into how each can be used to communicate data-driven insights effectively.

Understanding the Importance of Data Visualization
Before we dive into specific techniques, it’s essential to understand why data visualization matters. At its core, data visualization is about storytelling. It transforms raw data into a visual context, such as charts, graphs, and maps, making the data more accessible and understandable. This not only helps in identifying trends, outliers, and patterns but also aids in conveying complex concepts in a straightforward manner, enabling better decision-making.
Choosing the Right Visualization Technique
The key to effective data visualization lies in selecting the right technique for your data and the insights you wish to communicate. Here’s an overview of some common and impactful visualization techniques:
1. Bar Charts: Ideal for comparing the quantities of different categories or groups. They are straightforward and widely understood, making them perfect for a general audience.
2. Line Graphs: Best suited for showing changes over time. They help in identifying trends and forecasting future data points.
3. Pie Charts: Useful for illustrating proportions within a whole. They give a quick sense of the relative size of parts to the whole but are less effective when there are many categories or when precision is required.
4. Scatter Plots: Excellent for showing relationships between two variables. They can help in identifying correlations, trends, and outliers within datasets.
5. Heat Maps: Effective in displaying patterns or variations across a geographical region or even within a matrix format. They use color gradients to represent data values, making them visually engaging and informative.
6. Infographics: Combine graphics, charts, and text to tell a story or present a narrative. They are highly engaging and can be shared easily on social media, making them an excellent tool for reaching a broader audience.

Best Practices in Data Visualization
1. Simplicity Is Key: Avoid clutter and focus on the message you want to convey. Too much information can overwhelm your audience.
2. Be Mindful of Color Choices: Colors can influence interpretation, so use them wisely to highlight or distinguish data points without causing confusion.
3. Maintain Integrity: Ensure your visualizations accurately represent the data. Misleading scales or cherry-picked data can lead to incorrect conclusions.
4. Tailor to Your Audience: Understand the level of expertise of your audience and adjust the complexity of your visualizations accordingly.
5. Use Annotations and Labels Wisely: They can provide valuable context or highlight key insights within the visualization.
Emerging Trends in Data Visualization
As technology evolves, so do the methods and tools available for data visualization. Interactive dashboards, real-time data visualizations, and advanced analytics platforms are becoming more prevalent. These tools allow users to explore data in more depth, providing personalized insights and fostering a more interactive experience with the data.
Conclusion
Effective data visualization is both an art and a science. It requires a deep understanding of the data at hand, the message you wish to communicate, and the audience you are addressing. By choosing the right visualization techniques and adhering to best practices, you can transform complex data into compelling, insightful narratives. As we move forward, the ability to effectively communicate insights through data visualization will continue to be a critical skill in a world increasingly driven by data.
Get in Touch:
Contact Us: Drop us a line here for any questions or support.
Connect on LinkedIn: Stay in the loop. Connect with us on LinkedIn for the latest insights.
